PEIPEI The Chinese Pepe has seen PEIPEI price explode 2000x within the first week to hit $130m map. Will this be the next big Ethereum meme coin?
Peipei, the Chinese Pepe, which has gained a lot of traction by going up over 2000x within the first week, seems to have finally broken out of a consolidation period.
I told you, the Chinese frog is on its way to Valhalla$PEIPEI to 500M or the market is wrong pic.twitter.com/azAI8KgVNf
— cheatcoiner.eth (@cheatcoiner) July 10, 2024
Now sitting around $130 million market cap. What can we expect from it now? Let’s take a dive into some chart analysis.
PeiPei Price Analysis: Exploring Key Support And Resistance Levels

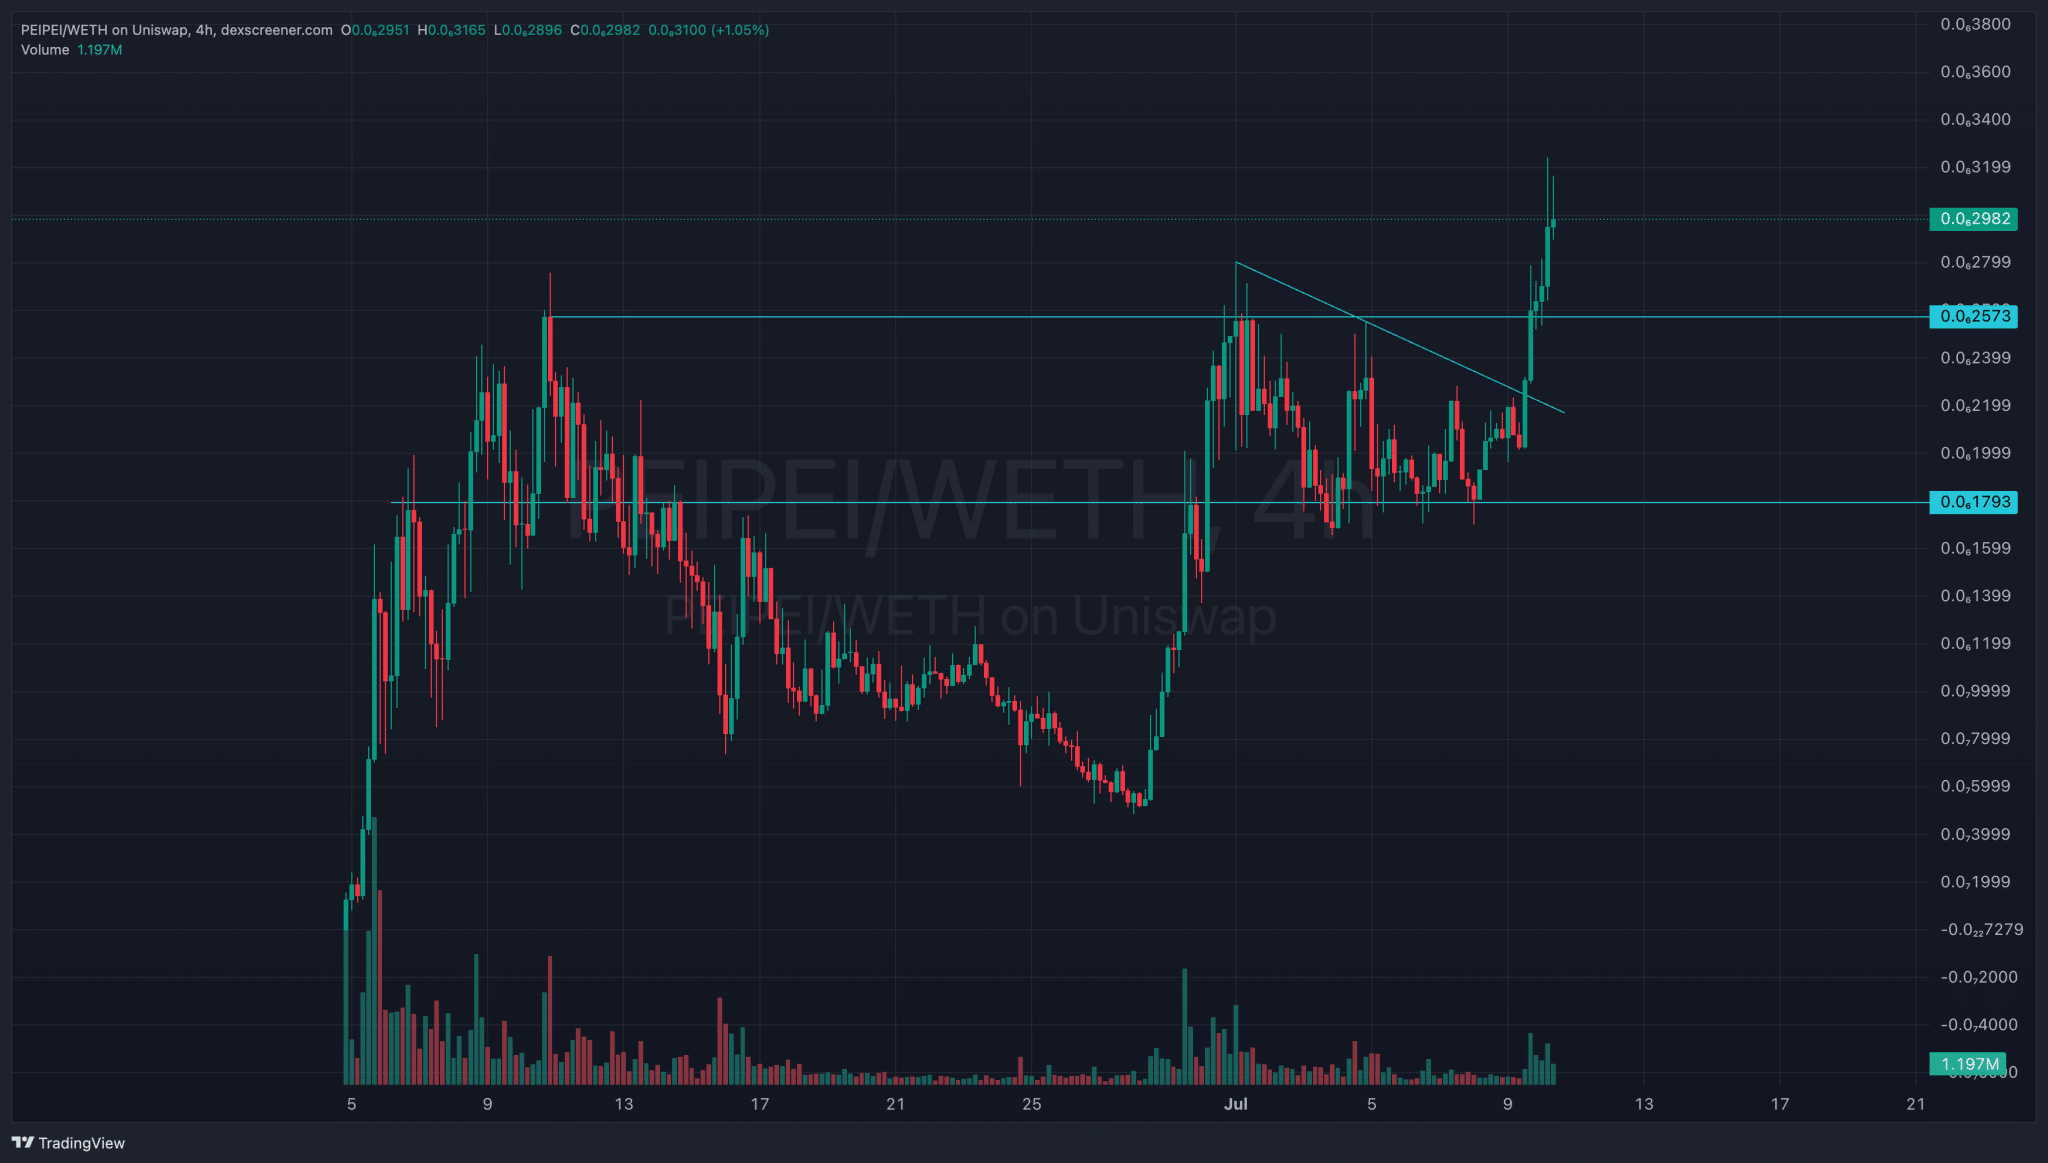
(PeiPei-USDT – support and resistance)
Adding some support and resistances to start off, we can see that the area around $0.0×1793 has been acting as support, and that’s also where price bounced from. $0.0×2573 has been the area that has given price some difficulties to break above for around one month.
Four times before finally breaking through yesterday, PEIPEI price was dumped after touching that area.
We can also include the trendline, where price has consolidated below for over a week. Breaking above that was our first clue to a change in trend, and the following break of resistance at $0.0×2573 was our clue that a new all-time high was on the horizon.
PEIPEI Price Analysis: A Closer Look at Moving averages

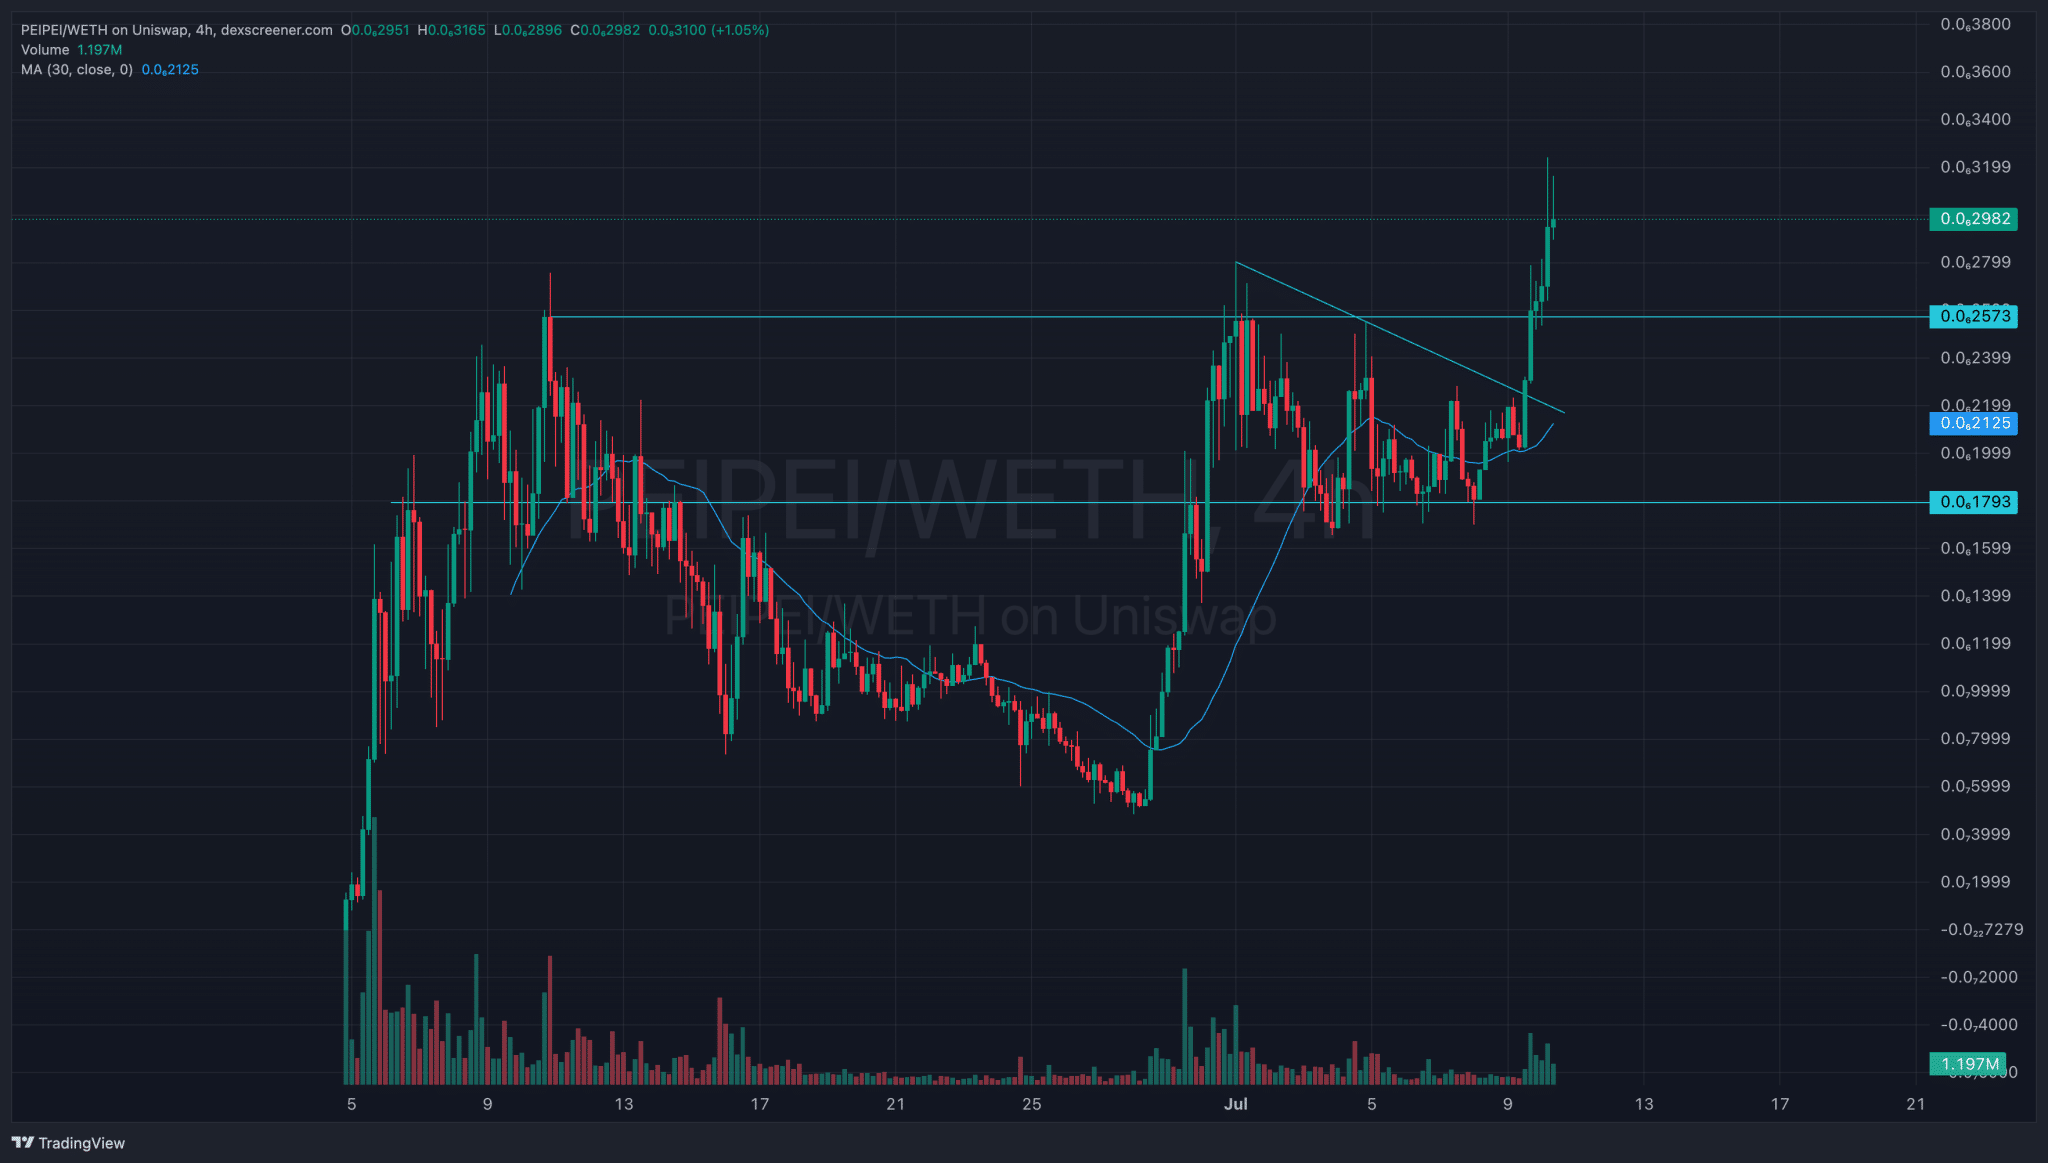
(PeiPei-USDT – Moving Averages)
Moving averages are highly used by traders to determine exits and entries. They are simply moving support and resistance because, as the name suggests, they use the closing price of the candles to make a moving average.
You will then, through experience, find out what moving averages work well on different pairs and timeframes. I can personally suggest using 30, 100, and 200 as those are the most used ones. The 200 MA will use the average price of the last 200 candle closes.
On PeiPei, I have used the 30 MA as my preferred one as it has been providing good support and resistance.
When adding the 30 MA, we can see that there was a floating resistance for the price to get above for 15 days, and the price peaked at 270% after crossing it. A
s it looks right now, from personal experience, I would like to see the moving average catch up and the price go a little sideways before continuing up.
DISCOVER: 16 Best Altcoins to Invest in 2024
Price Analysis: Relative Strength Index

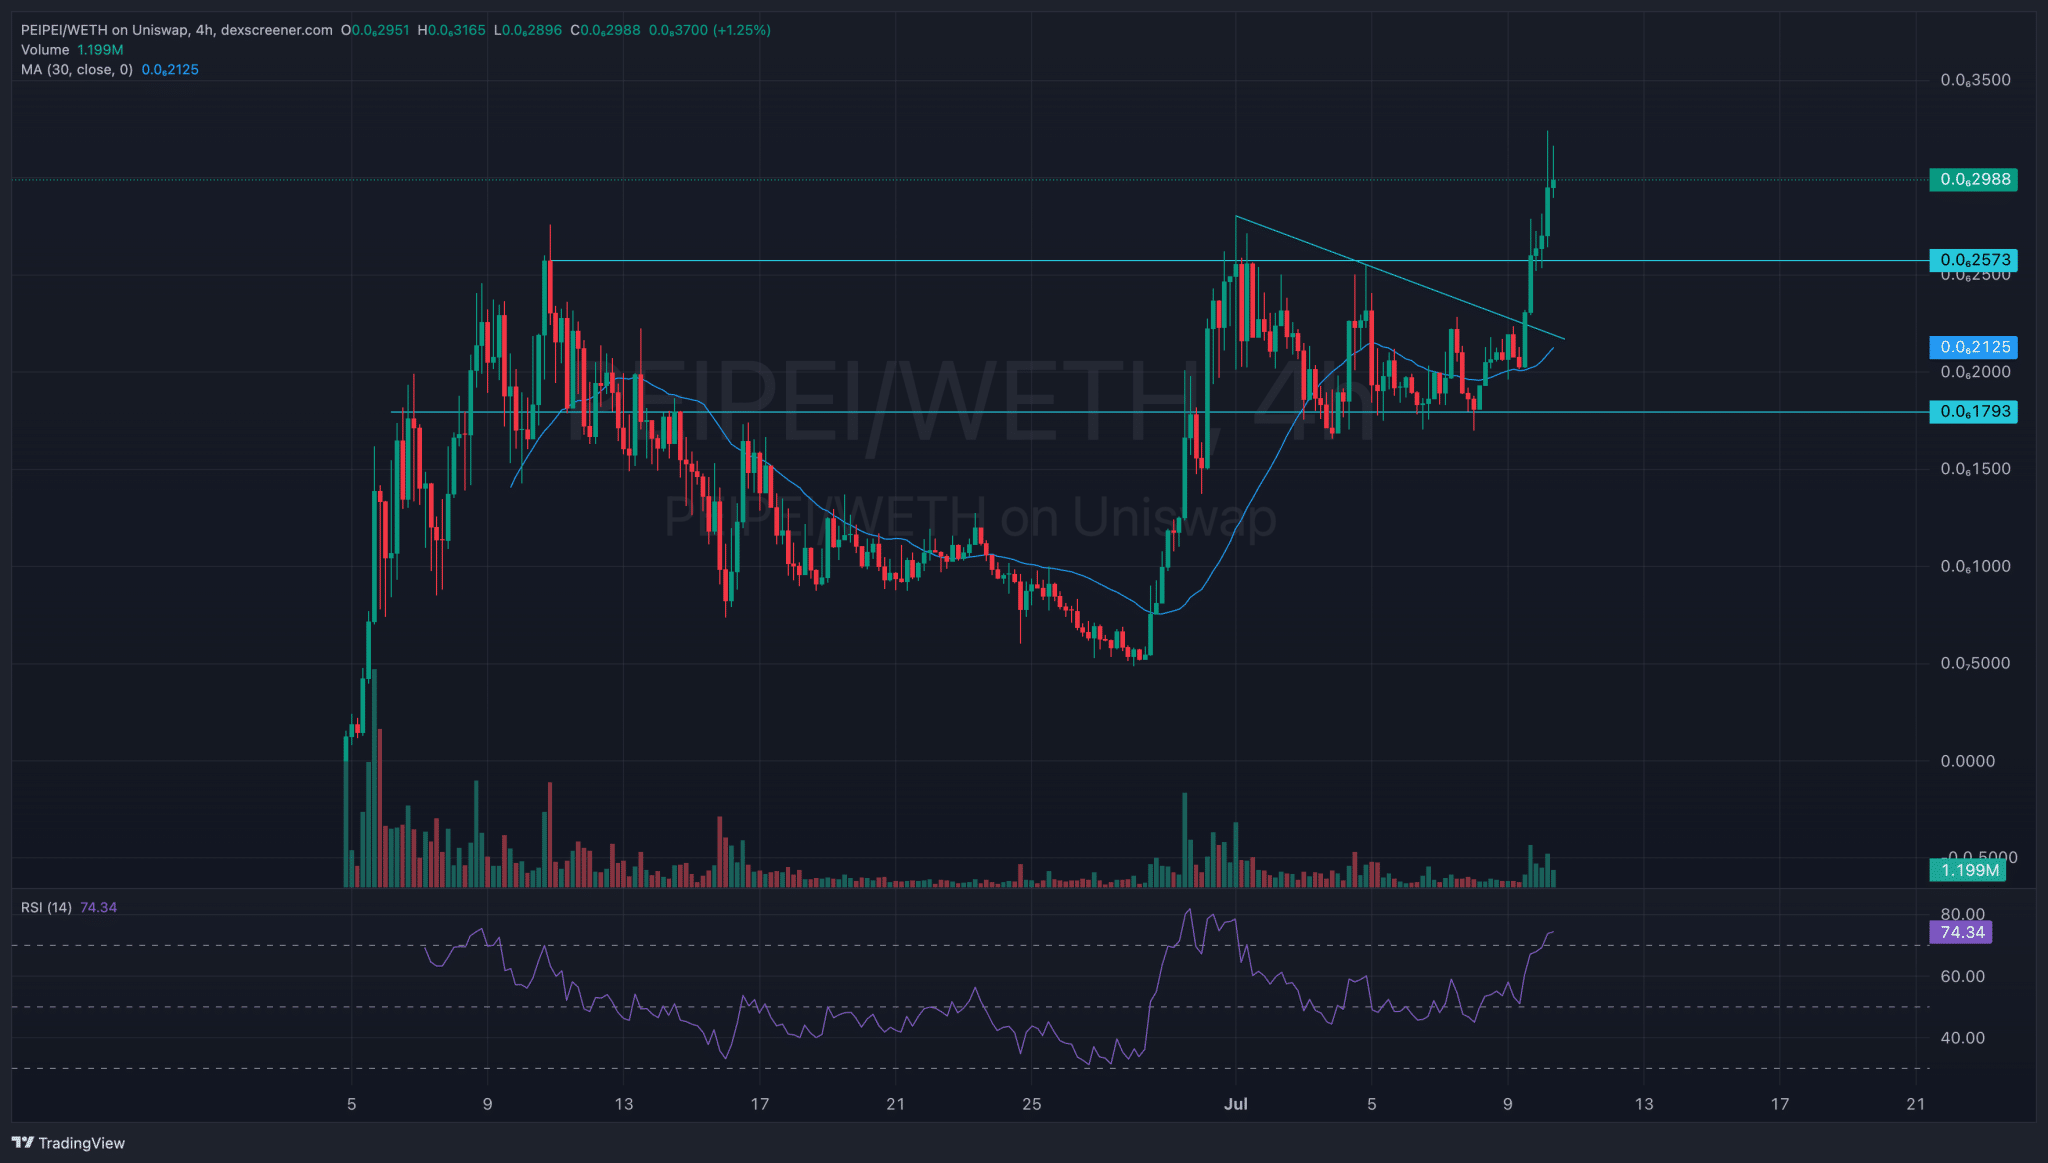
(PeiPei-USDT – Relative Strength Index)
Moving on, look at Relative Strength Index, also known as RSI. We can gather some insight into the strength of the asset. Something is considered oversold when the indicator reaches below 30 and overbought above 70. It does not mean it is bottomed or topped.
In fact, being overbought and able to stay overbought will indicate strength and vice versa for being oversold. However, we can use this information in confluence with the rest of our analysis to see if we can gain some insight. We can indeed see that when we add RSI, it’s overbought, being around 75.
Third run at resistance…
Above? Clear skies & wife changing gains. pic.twitter.com/2FvH3SZxzb
— cousin crypto (@cousincrypt0) July 9, 2024
Summarizing all of our analysis, we can gather that Price broke out of a month-long consolidation. Reached a new all-time high within hours.
Moving averages is lacking a lot behind and RSI is overbought, both could signal some consolidation for a day or two before making a new all time high. But as you can see above, experts with a great track record, such as cousin crypto, are indeed also bullish on PeiPei!
EXPLORE: What is DeFi? A Beginner’s Guide
Disclaimer: Crypto is a high-risk asset class. This article is provided for informational purposes and does not constitute investment advice. You could lose all of your capital.


